Leaking Flares: Why Independent Monitoring Matters
Published on: Sep 04, 2024
Did you know that poorly functioning flares at oil and gas facilities can release significant amounts of methane? Methane (CH₄) is a potent greenhouse gas, up to 80 times more effective at trapping heat than carbon dioxide. Flares are commonly used at these facilities to burn off excess hydrocarbons, converting them into CO2 and water vapor. These flares are crucial for ensuring safety, managing waste, and controlling emissions. To reduce the risks of methane leaks, the U.S. Environmental Protection Agency (EPA) requires flares in the oil and gas sector to achieve at least 98% destruction efficiency for hydrocarbons.
However, regulations alone do not guarantee effectiveness. Independent monitoring has revealed a gap between these regulations and day-to-day realities, highlighting the need for continuous oversight to ensure compliance. While the EPA has made significant strides, Carbon Mapper's findings have frequently identified partial combustion in flares. This indicates that substantial methane and volatile organic compound (VOC) emissions still escape into the atmosphere. These methane emissions exacerbate climate change, and co-emitted air toxics contribute to air pollution, contributing to the warming of our planet and posing health risks to communities.

While flares are designed to burn off excess gas from oil and gas production, incomplete combustion can cause significant methane emissions.
The Problem: Incomplete Combustion in the Fossil Fuels Sector
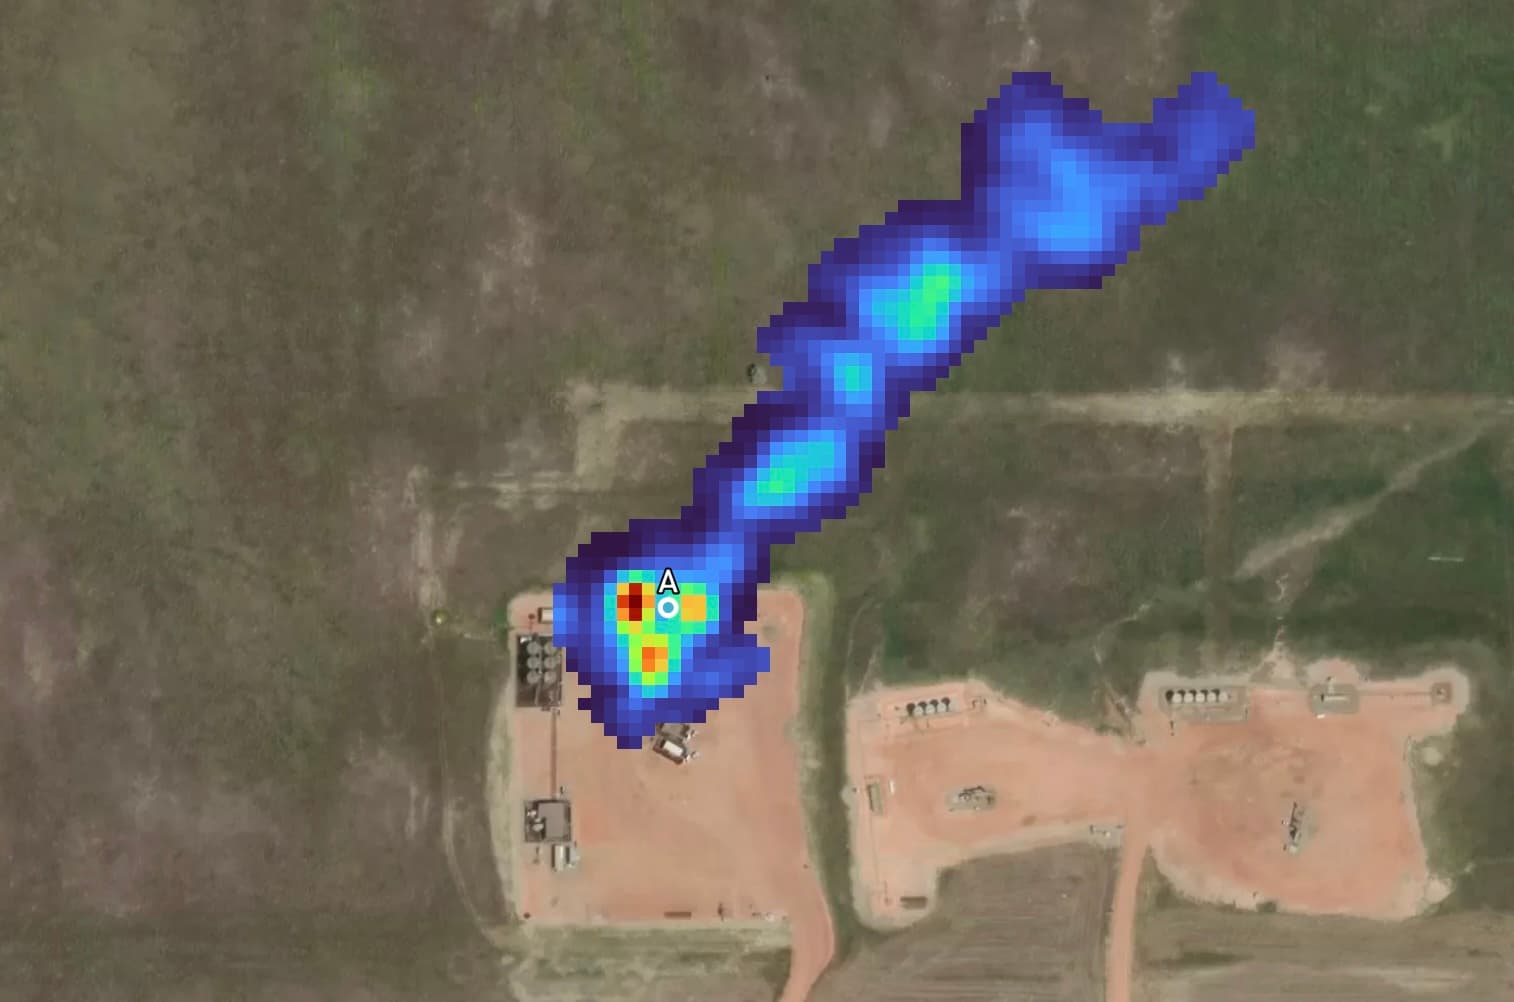
Flares are designed to burn off excess gas from oil and gas production, yet incomplete combustion can still result in significant methane emissions, as well as VOCs and soot, which can have negative health impacts. For instance, on May 17, 2024, the flare below in the Permian Basin (the highest producing oil field in the U.S.) released significant amounts of methane into the atmosphere, with an emission rate of 385 ± 153 kg CH4 per hour. Examples like this, where flares fall short of EPA requirements, underscore the ongoing need for independent monitoring of infrastructure in the fossil fuel sector. A focused emissions detection and quantification approach can help improve understanding of regulatory compliance and highlight discrepancies between actual practices and regulatory standards.

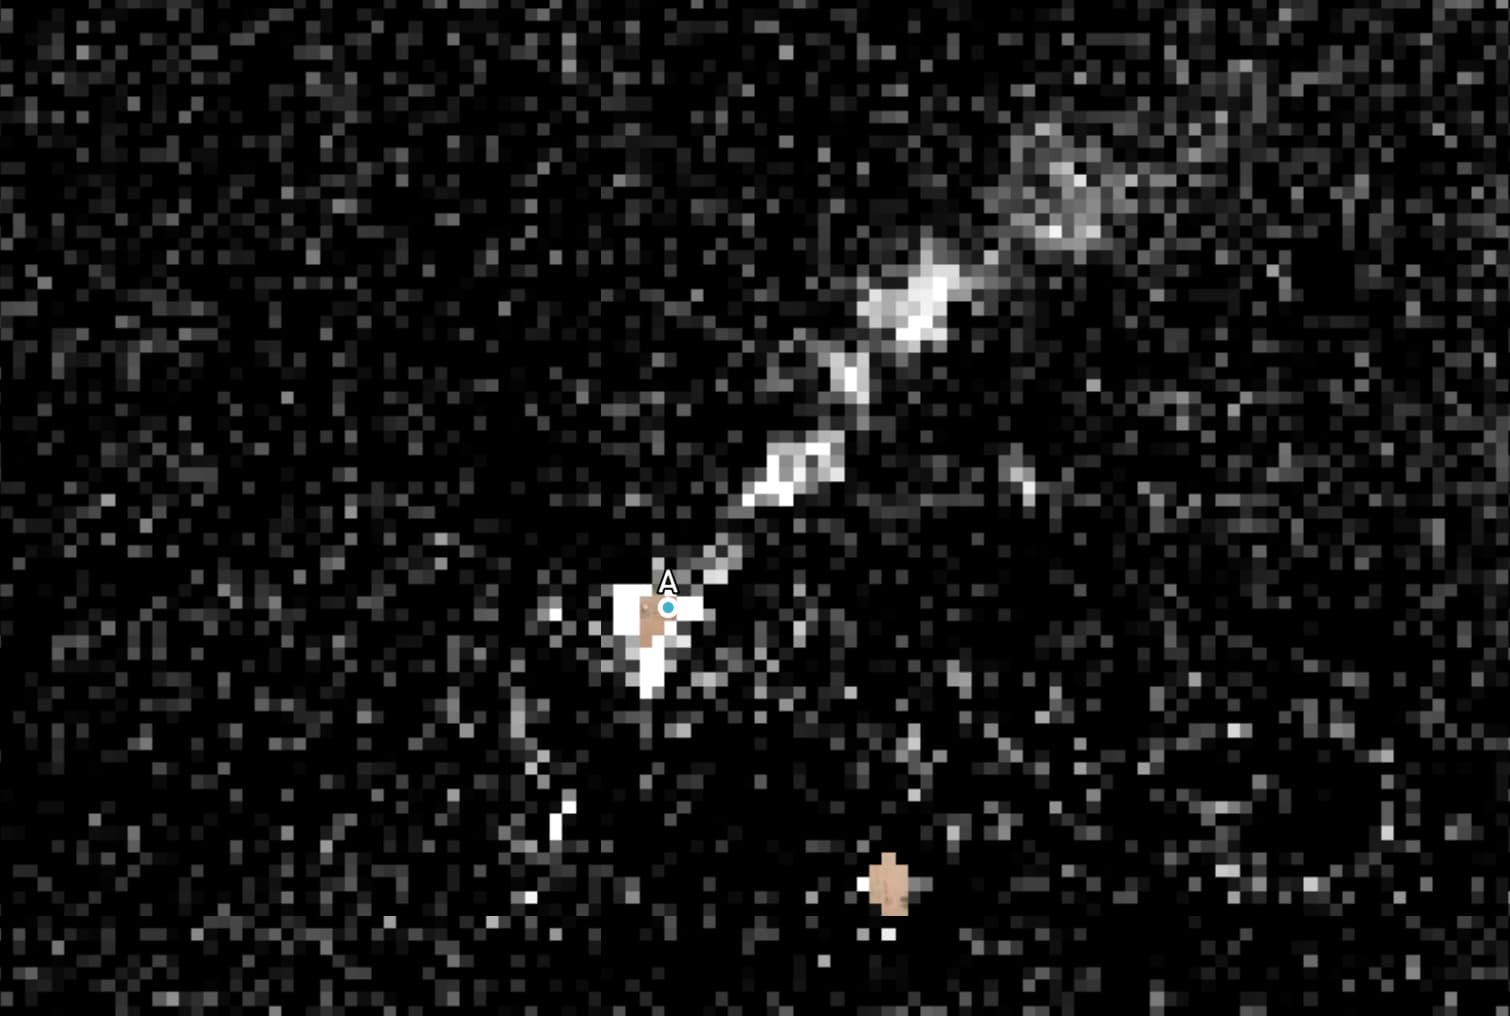
Similar instances have also been observed in other major oil and gas basins. For example, on June 22, 2022, this flare in the Bakken Formation in North Dakota (one of the largest deposits of oil and natural gas in the U.S.) was estimated to release methane at 1645 ± 679 kg CH4 per hour.


A malfunctioning flare in Western Iran was observed emitting an estimated 9553 ± 1251 kg CH4 per hour on June 21, 2024. Examples like these underscore the widespread nature of the issue and the critical need for comprehensive monitoring worldwide.
The Importance of Independent Emissions Monitoring
Discrepancies between actual flaring practices and regulatory standards highlight the necessity of independent monitoring of methane point sources. Flares are often subject to varying operational conditions, such as changes in gas composition, flow rate, and weather conditions, which can significantly impact combustion efficiency. The quality and maintenance of the equipment also play a crucial role; poor maintenance, equipment degradation, or substandard components can lead to incomplete combustion and reduced efficiency.
Measuring flare efficiency accurately in real-time is a significant challenge that remote sensing technology can help address. Traditional leak detection methods may miss partial combustion or intermittent flaring issues, leading to discrepancies between reported and actual efficiency. In such cases, independent monitoring can provide a more accurate picture of compliance with federal and local regulations. It can also reveal the realities of standard practices on the ground, which may differ significantly from what is mandated.
Organizations like Carbon Mapper play a crucial role in environmental protection by pinpointing and documenting methane super-emitters and potential instances of partial combustion. Our work provides transparency and mitigation opportunities for industry operators and encourages implementing best practices—including minimizing product waste.
Remote sensing technology can help address the challenge of measuring flare efficiency accurately and in real-time.
Moving Forward with Remote Sensing
Ensuring compliance with regulations and improving the effectiveness of emission control measures requires a multi-faceted approach that includes robust monitoring. Independent monitoring via remote sensing technology can complement regulatory efforts by providing an additional layer of oversight and accountability.
As we continue to address the challenges of air quality and climate warming, the work of organizations like Carbon Mapper becomes increasingly important. By shedding light on the realities of methane emissions and advocating for stronger compliance, we provide a science-backed and data-focused approach to ensuring a sustainable environment and protecting public health.
Explore our data portal at https://data.carbonmapper.org to analyze various basemaps and gain insights into different types of infrastructure, including those where flaring may occur. While there isn’t a direct filter for flares, you can indirectly identify potential flaring sites by examining satellite basemaps for relevant infrastructure. The portal also offers interactive maps and data visualizations to help you explore and identify methane sources in your region of interest.