
Methane Super-emitters: An Opportunity for Global Action in the Waste Sector
Published on: Jun 24, 2025
Key findings from surveying more than 10,000 global waste sites
Since 2022, Carbon Mapper has analyzed satellite data from dumpsites and landfills across the globe, revealing the sources of methane super-emitters in this key sector. Large methane emissions were detected at 371 waste sites across 71 countries — totaling 6.1 Tg of methane per year, which is the emissions equivalent of 40 million cars on the road for one year. Key findings include the following:
- Some countries have many waste super-emitters, including the U.S., India, Mexico, Brazil, and Chile. Significant reduction of methane emissions from waste will require strategies that address these super-emitters.
- Opportunities exist for a number of sub-national jurisdictions to significantly reduce methane emissions. These include mitigating super-emitters in key cities — for example the city of Jakarta in Indonesia and the city of Johannesburg in South Africa. Additional strategic opportunities to mitigate waste emissions could be targeting especially egregious emitters, such as the Magtaa Kheira landfill in Algeria and the Portillo Grande and Modelo Callao landfills in Peru.
- Fortunately, data is now readily available and publicly accessible to help guide methane mitigation, including identifying sites with the highest emissions, verifying emissions reductions as mitigation solutions are implemented, and assessing the impact of waste management practices on emissions. One valuable resource jurisdictions can use to turn methane emissions data into action is the Lowering Organic Waste Methane (LOW-M) Data Strategy, launched in 2025 by LOW-M partners. This strategic framework empowers jurisdictions to design mitigation action plans to cut waste methane emissions using data-driven insights provided by Carbon Mapper and others.
Background: Methane data can help track emissions at dynamic waste sites
As organic waste in landfills and dumpsites decomposes it generates methane, some of which will escape into the atmosphere as emitted methane. Globally, it is estimated that 20% of anthropogenic (human-caused) methane emissions come from the waste sector with most of these emissions from final waste disposal at landfills and dumpsites.
Landfills can be very dynamic; for example, there is often construction at landfills to handle new waste and maintain gas collection and landfill cover infrastructure. Landfills and dumpsites are also exposed to changing environmental conditions, such as rain and atmospheric pressure. These operational and environmental factors influence how much methane is emitted, which can also change over time as these sites expand.
Models are used to estimate methane emissions using information about the underlying processes that generate methane and the various pathways for methane to escape from the landfill or dumpsite to the atmosphere. However, these modelled emission rates may not be accurate. This is a concern given that models are often used by industry and government to monitor methane emissions at individual waste sites and track emission trends across the sector. The model estimated emission rate will be wrong if inaccurate data is used or if the methane generation or emission process is misrepresented.
Analyzing methane data from direct observations, also known as methane monitoring, can improve and supplement emissions estimates from models. A simple example is using emissions data from direct observations to identify modeled emission rates that are over- or under-estimated.
Methane observation data can also be used to better understand and characterize methane emissions from landfills and dumpsites. This includes identifying and prioritizing the highest emitting sites for mitigation action. Data can also guide operators to find and fix methane leaks at landfills. While various advanced technologies can be leveraged to monitor methane at landfills and dumpsites, some technologies are better suited for specific use cases in the waste sector, as outlined for the U.S. in nonprofit research organization RMI’s Advanced Technology Playbook.
Overview of airborne and satellite remote sensing data at landfills and dumpsites
Carbon Mapper uses airplanes and satellites — passive remote sensing instruments — to detect methane emissions; this means that they observe light from the sun, which is then translated into an estimate of methane in the atmosphere. When landfills and dumpsites emit large amounts of methane, the satellite will see this as an enhancement of methane in the atmosphere at the site above normal levels, called a methane plume.

Although methane and carbon dioxide (CO2) emissions are invisible to the naked eye, we can use technology called imaging spectrometers to "see" these harmful emissions. Carbon Mapper detects and quantifies methane and CO2 super-emitters via remote sensing. Imaging spectrometers act as the “eye” of the aircraft or satellite — enabling us to see methane and CO2 emissions and gather important data about them. | Map Data Credit: Google
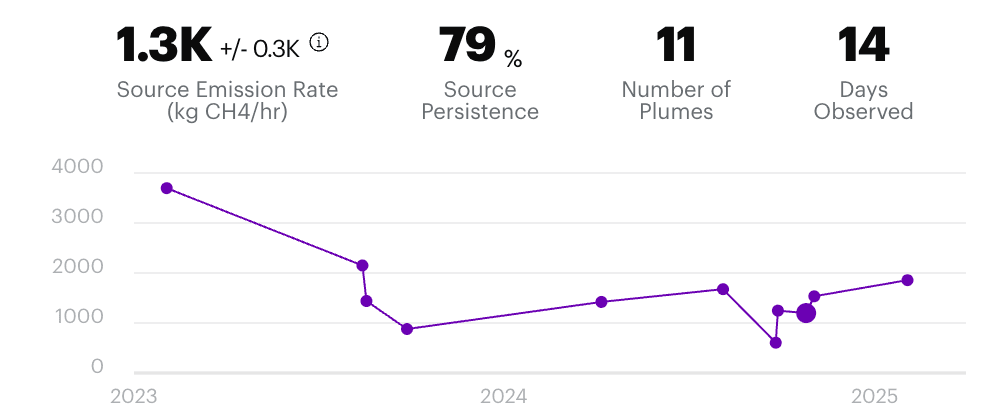
For every methane plume we find, we create an image of the plume, estimate the location where the methane is coming from on the ground (plume origin), assign the sector responsible for the emission (e.g., waste sector), and estimate a methane emission rate.
In the example below (Figure 1), a landfill with a detected methane plume is shown. Each landfill and dumpsite is treated as a unique methane source. Multiple methane plumes are observed at a particular source over time, and we can average the observed plumes to generate a source emission rate — the average observed emission rate for a specific waste site.
.jpeg&w=3840&q=75)

A Global Picture: Satellites help identify super-emitters at waste sites around the world
From August 2022 to May 2025, Carbon Mapper surveyed over 50 million km2 with the NASA EMIT and Tanager-1 instruments, as shown below (Figure 2). Some regions have limited coverage due to factors like instrument orbits — where we are able to look— and observing strategy — where we opt to look. For example, less EMIT data is available in northern latitudes, because the instrument is on the International Space Station, which does not orbit above 52° N latitude.
The amount of collectible methane data at a given landfill or dumpsite depends on our ability to successfully observe the site without interference (e.g., clouds covering the landfill) and detect emissions at the site (i.e., see a methane plume). If we want to collect data in a very cloudy region, we can adjust our strategy to observe the site more often, increasing the likelihood of a cloud-free observation.
By the Numbers
10,000 – waste sites observed
371 – landfills and dumpsites with detected super-emitters (3.7% of observed sites)
71 – countries with detected waste super-emitters
5 – average super-emitters per country
Prior to the August 2024 launch of Tanager-1 and before it began providing routine data, satellite methane data was mostly limited to EMIT. Tanager-1 can detect lower emissions from a waste site compared to EMIT because it has a lower detection limit. As Tanager-1 continues routine operations, more granular data will be available for waste sites where emissions are below the EMIT detection limit.
With EMIT starting in 2022 and Tanager-1 starting in early 2025, we have observed more than 10,000 waste sites, over 90% of which were observed in 25% or less cloud cover. Of these sites, we have detected super-emitter methane emissions at 371 landfills and dumpsites, compared to over 1,700 super-emitting facilities detected at oil and gas facilities. The waste super-emitters are spread across 71 countries with an average of five detected per country. We find super-emitting landfills mainly in the Americas, North Africa, and Europe; whereas, we see a mix of super-emitter dumpsites and landfills in sub-Saharan Africa, and Central and Southeast Asia.


Emissions detected from waste sites can be translated into an annual emission rate if we assume detected emissions represent average conditions. Under this assumption, the landfills and dumpsites where we detected emissions have a total emission of 6.1 Tg of methane per year (or 171 MMTCO2e, equivalent to about 40 million cars on the road).
These 371 high emitting landfills and dumpsites can account for 9% of the global human-caused methane emitted from the waste sector as estimated in methane inventories and reported by Saunois et al. (2025).
Addressing waste methane — from the scale of countries to jurisdictions to individual sites
The graphs below list the countries and cities with the most satellite-detected super-emitters (Figure 3), including the United States (111), India (32), Mexico (23), Brazil (22), and Chile (14). The cities with the most super-emitters include Mexico City (Mexico), Mumbai (India), and Sao Paulo (Brazil).
For countries with a high number of waste super-emitters, reducing national waste sector methane emissions will require mitigation efforts at multiple waste sites. This may include strategies that target national-level policy changes or empowerment of sub-national actors. For example, both the U.S. and India have multiple cities in different states with a high prevalence of super-emitters (Figure 3), which means that mitigation opportunities exist across multiple sub-national jurisdictions.

Figure 3. Countries and cities with the highest number of super-emitters detected by satellite. For each country (dark blue) and city (light blue), we show the number of emitting sites in the waste sector. We consider a waste site to be associated with a city if it is within 50 kilometers of the city center.
Waste sites with significant emissions
The map below (Figure 4) shows the individual sites that present a significant mitigation opportunity with the highest average site emissions at Norte III landfill in Buenos Aires (Argentina), Magtaa Kheira landfill in Blida (Algeria), and Jawahar Nagar dumpsite in Hyderabad (India).
In cases where a particular city or waste site has an outsized contribution to national waste emissions, mitigation strategies focused at the scale of an individual site or city are key for reducing national waste emissions.
For example, many of the high-emitting waste sites in the chart below (Figure 4) can account for at least 8% of national solid waste methane emissions in the most recent national inventories, including the sites in Buenos Aires (Argentina), Lima/Callao (Peru), and Blida (Algeria) which each account for 8-40% of national solid waste emissions. At the city-level (Figure 3), Johannesburg (South Africa) and Jakarta (Indonesia) have three and five satellite-detected super-emitters, respectively, and these sites together can account for 3-24% of the national solid waste methane emissions in each country.

Figure 4. Top emitting landfills and dumpsites. The map shows the landfills and dumpsites with the highest average methane emissions. We only consider sites that have been observed emitting more than once.
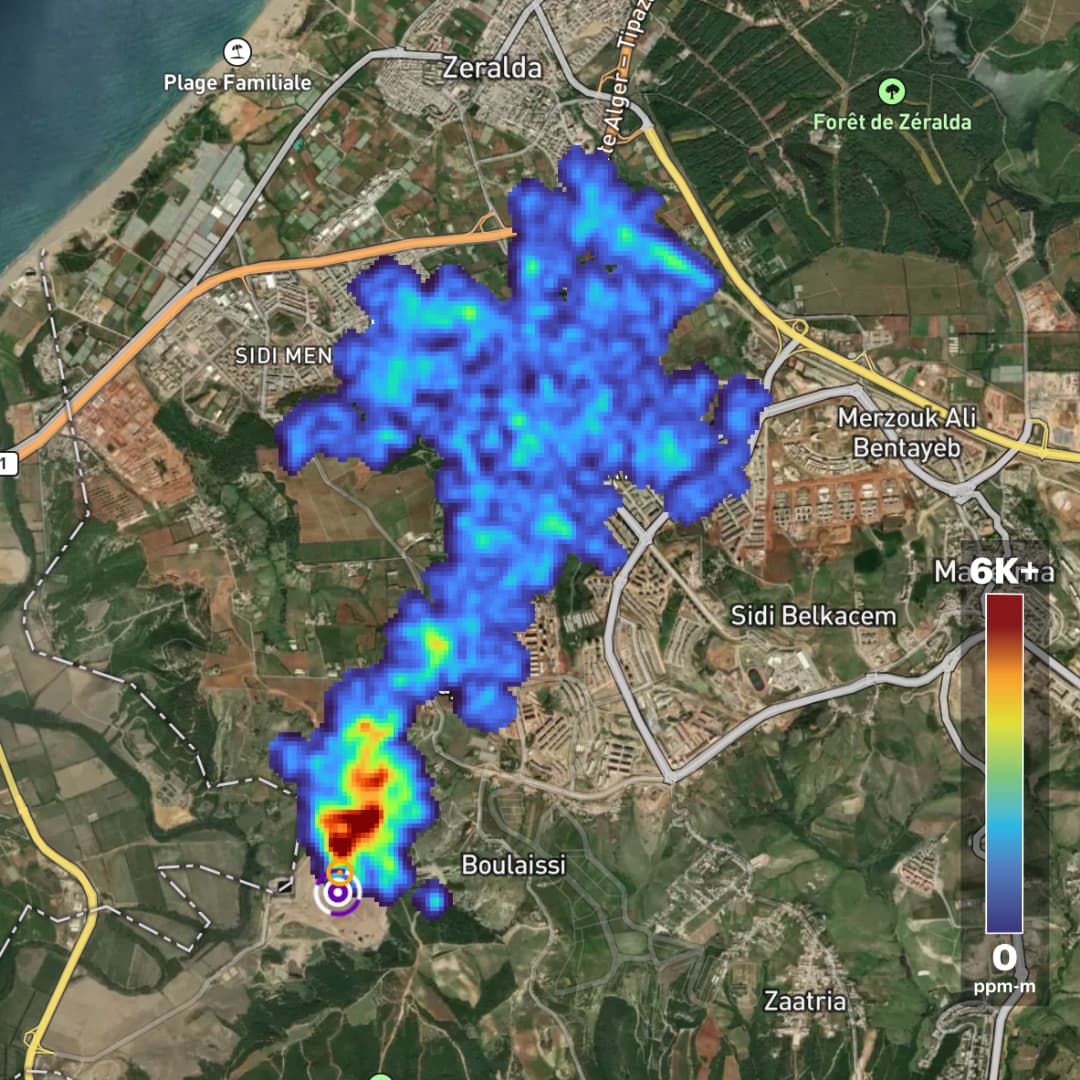
Zooming In: Key Waste Mitigation Opportunity in Algeria
One of these highest emitting landfills is the Magtaa Kheira landfill in Blida, Algeria. Magtaa Kheira is about 20 kilometers southwest of Algiers in the Mahelma municipality. The landfill can account for 88% of waste super-emitter emissions in Algeria, equivalent to one-third of Algeria’s reported national solid waste methane emissions. Our satellite data show emissions that are almost two orders of magnitude larger than modelled emissions in the EDGAR and Climate Trace inventories, highlighting the value of using satellite data to prioritize high-emitting sites for mitigation action.
.png&w=3840&q=75)
Translating Methane Data to Action
Observations of methane emissions are just one piece in the mitigation puzzle. Collected data can be used to prioritize and plan next steps. For example, EMIT data can be used to prioritize the highest-emitting sites within a country for future mitigation action. While modeling tools like the WasteMAP Decision Support Tools can be used by cities and operators to find and test effective mitigation pathways for reducing emissions at the satellite-identified sites.
Alternatively, remote sensing data can be combined with site information at a particular site to identify work practices or specific infrastructure that contributes to super-emitter behavior.
For example, Carbon Mapper coordinated with U.S. state governments in California and Pennsylvania to share methane observations from airborne instruments with landfill operators. Operators conducted a voluntary follow-up investigation to identify the infrastructure and activities causing methane plumes. In California, these coordinated efforts between the state and industry helped identify the landfill work face – where new waste placement and construction activities occur – as a common source of emissions at landfills.
Once mitigation activities are underway, routine monitoring can be used to verify that emissions are decreasing as expected. In some cases, methane monitoring can provide short-term verification that an engineering or work practice adjustment addressed a known emission source.
Case studies in methane mitigation action in the waste sector
At the Sunshine Canyon landfill in California, for instance, observations from airborne instruments were used to identify parts of the landfill where surface cover needed improvement. Improvements to the cover and the gas capture system were made as part of a coordinated effort between the operator and local enforcement agency, and follow-up monitoring verified emissions reductions.
In cases where mitigation action focuses on reducing the volume of organics sent to landfills (e.g., organics diversion and waste generation reduction), we expect methane generation at the final waste disposal site will decrease over time, leading to reduced emissions. Sustained methane monitoring at waste sites can be used to track the impact of these mitigation pathways on emission trends over time. Crucial to this is establishing an accurate baseline emission estimate for the site, which can be done through methane monitoring before mitigation action or estimation of baseline emissions using models that have been validated with observations.
The LOW-Methane Data Strategy demonstrates how satellite data and methane models can be used together to establish waste site baseline emissions and track post-mitigation trends over time. Many countries and sub-national jurisdictions (including some in Figure 3) are partners to the LOW-Methane Initiative, which is encouraging for future methane reductions in this sector. In addition to these global initiatives, major U.S. waste companies have committed to monitor methane and reduce emissions, showing promise for future data-driven mitigation.
The Global Methane Pledge, launched in 2021, looks to reduce methane emissions through country commitments to collectively reduce emissions by 30% below 2020 levels by 2030. Considering methane super-emitters in the waste sector can account for a large fraction of national waste methane emissions in many countries, addressing this issue represents a pathway to reduce overall national and global waste emissions. This opportunity — paired with greater accessibility of methane observations from space via satellite monitoring — can support informed decisionmaking and verify emissions reductions in this critical sector.